Visual Learning: Managing Cognitive Load with Diagrams

Understanding Cognitive Load and Its Importance
Cognitive load refers to the amount of mental effort being used in the working memory. In simple terms, it's how much information your brain can handle at one time. When cognitive load is too high, learning can become inefficient, leading to confusion and frustration.
The mind is not a vessel to be filled, but a fire to be kindled.
To illustrate, imagine trying to learn a new recipe while also multitasking with a TV show on in the background. The distractions can overwhelm your ability to absorb the recipe's steps. Similarly, excessive information can hinder learning, making it crucial to manage cognitive load effectively.
Recognizing the different types of cognitive load—intrinsic, extraneous, and germane—can help in creating a more focused learning environment. By understanding these concepts, educators and learners can tailor their approaches to enhance comprehension and retention.
The Role of Visual Learning in Education
Visual learning is an approach that emphasizes the use of images, diagrams, and other visual aids to facilitate understanding. It's particularly effective because many people are visual learners, meaning they grasp information better when it's presented visually. This method can simplify complex ideas, making them more digestible.
For example, consider how a flowchart can clarify a complicated process, such as a scientific experiment. Instead of sifting through paragraphs of text, a visual representation can quickly convey the essential steps and relationships between variables, enhancing comprehension.
Cognitive Load Affects Learning
Managing cognitive load is essential for effective learning, as excessive information can lead to confusion and hinder retention.
Integrating visual learning techniques into education not only helps in retaining information but also encourages creativity and critical thinking. When learners engage with visuals, they can explore concepts from various angles, fostering a deeper understanding.
How Diagrams Help Manage Cognitive Load
Diagrams serve as powerful tools in managing cognitive load by organizing information visually. They break down complex information into manageable parts, allowing the brain to process data more efficiently. This can lead to improved memory retention and understanding.
A picture is worth a thousand words.
Think about how a mind map visually represents ideas branching out from a central theme. This layout helps learners see connections and relationships, reducing the mental strain of trying to remember everything at once. Instead of juggling numerous facts, learners can focus on understanding the overarching concept.
By using diagrams, learners can prioritize information, focusing on the most critical aspects first. This structured approach minimizes distractions and clarifies the learning path, ultimately leading to a more productive educational experience.
Types of Diagrams Beneficial for Learning
There are various types of diagrams that can enhance learning, each serving a unique purpose. Flowcharts, for instance, outline processes in a sequential manner, helping learners understand the steps involved in a task. Similarly, Venn diagrams visually represent relationships, making it easier to compare and contrast concepts.
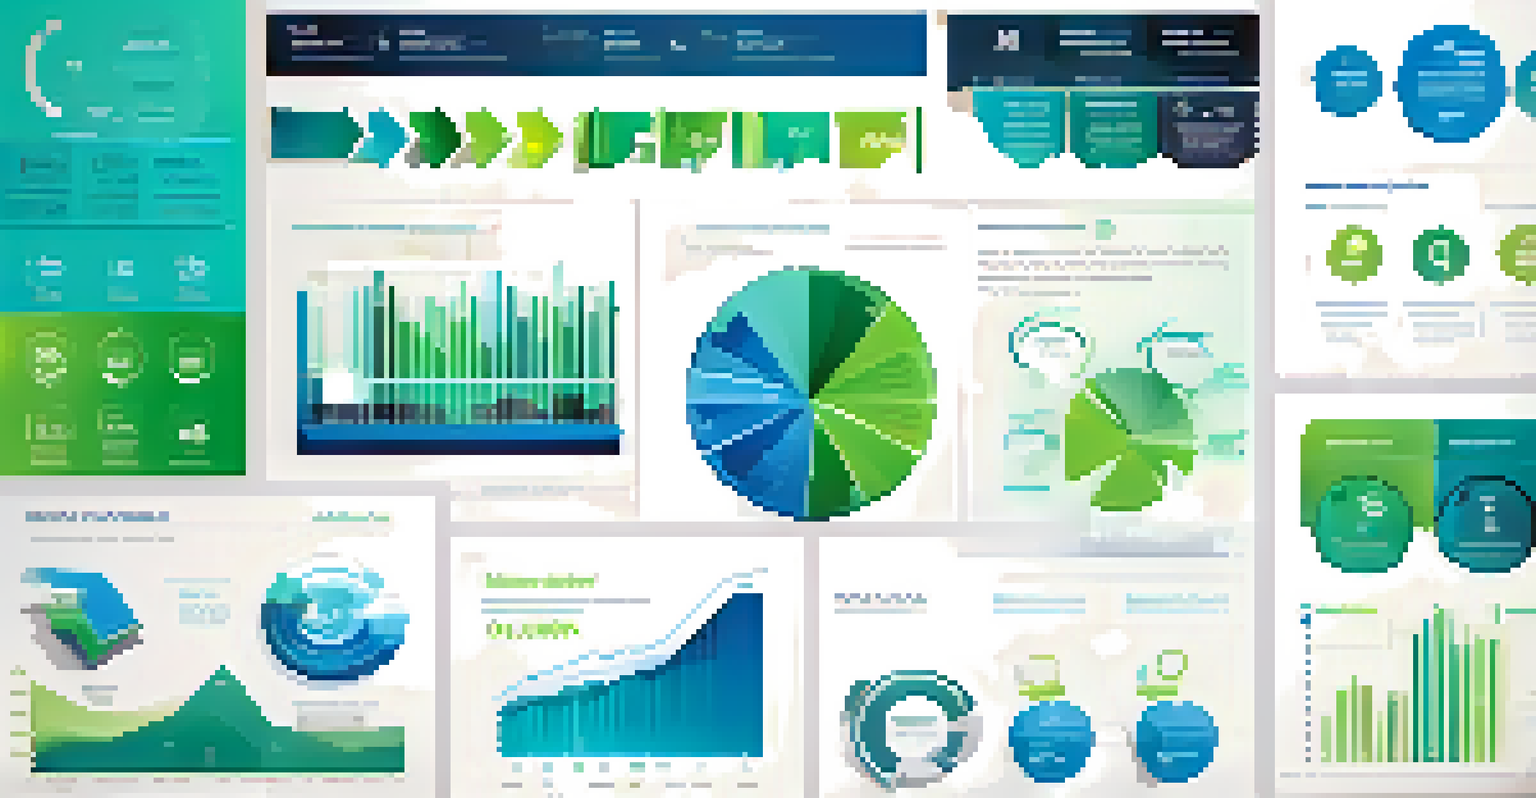
Another effective type is the infographic, which combines visuals and text to convey information quickly. Infographics can summarize complex data, making it accessible and engaging. They often utilize charts and icons, providing a snapshot of information without overwhelming the viewer.
Visual Learning Enhances Understanding
Utilizing visual aids like diagrams and flowcharts simplifies complex ideas, making them easier for learners to grasp and remember.
Moreover, timeline diagrams can help learners grasp historical events or project milestones chronologically. By visually placing events in order, learners can better understand sequences and causation, enriching their overall comprehension.
Creating Effective Diagrams for Learning
To create effective diagrams, it's essential to focus on clarity and simplicity. Start by identifying the key concepts or processes you want to convey, and avoid cluttering the diagram with unnecessary details. A clean and straightforward design allows learners to quickly grasp the main ideas without feeling overwhelmed.
For example, if you're illustrating a scientific cycle, use clear labels and distinct colors to differentiate each stage. This visual clarity enables learners to see the flow of information while minimizing cognitive load. Remember, less is often more when it comes to visual aids.
Additionally, consider incorporating interactive elements, such as clickable diagrams in digital formats. These can enhance engagement and allow learners to explore information at their own pace, further reinforcing their understanding without adding to cognitive overload.
Integrating Diagrams into Learning Environments
Integrating diagrams into various learning environments can significantly enhance the educational experience. In classrooms, instructors can use projectors or whiteboards to display diagrams during lectures, providing a visual reference for students. This helps bridge the gap between theoretical concepts and practical applications.
In online learning environments, diagrams can be included in presentations, e-books, and educational videos. By incorporating visual elements, educators can create engaging content that resonates with diverse learning styles. This adaptability ensures that all learners have the opportunity to connect with the material.
Diagrams Aid Information Processing
Diagrams help organize information visually, allowing learners to focus on key concepts without feeling overwhelmed.
Moreover, encouraging students to create their own diagrams can promote active learning. When learners synthesize information into visual formats, they internalize knowledge more effectively. This hands-on approach fosters collaboration and discussion, enhancing the overall learning experience.
Future Trends in Visual Learning and Diagrams
As technology advances, the future of visual learning and diagrams looks promising. Innovations like augmented reality (AR) and virtual reality (VR) are beginning to transform how we interact with diagrams, creating immersive learning experiences. These technologies can bring concepts to life, allowing learners to explore information in a three-dimensional space.
For instance, imagine studying anatomy with a VR application that lets you visualize the human body from various angles. This interactive approach enhances understanding and retention, making complex subjects more approachable. The potential for technology to augment visual learning is vast and exciting.
In addition, data visualization tools are becoming increasingly sophisticated, allowing learners to represent complex data sets visually. As these tools evolve, they can help learners make sense of information in real time, further supporting effective learning and reducing cognitive load.