Creating Engaging Visual Content for Online Learning
Understanding the Importance of Visual Content
Visual content plays a crucial role in online learning, making complex ideas easier to grasp. Studies have shown that people retain information better when it's presented visually, compared to text alone. This means incorporating images, videos, and infographics can significantly enhance the learning experience for students.
A picture is worth a thousand words.
Moreover, visuals can break up text and create a more dynamic learning environment. Think of a textbook filled with endless paragraphs; it can be overwhelming. However, when you sprinkle in diagrams or visuals, the content becomes more digestible and engaging.
In essence, effective visual content not only aids comprehension but also keeps learners interested. It engages their senses, making the learning process more interactive and enjoyable.
Choosing the Right Visual Formats for Learning
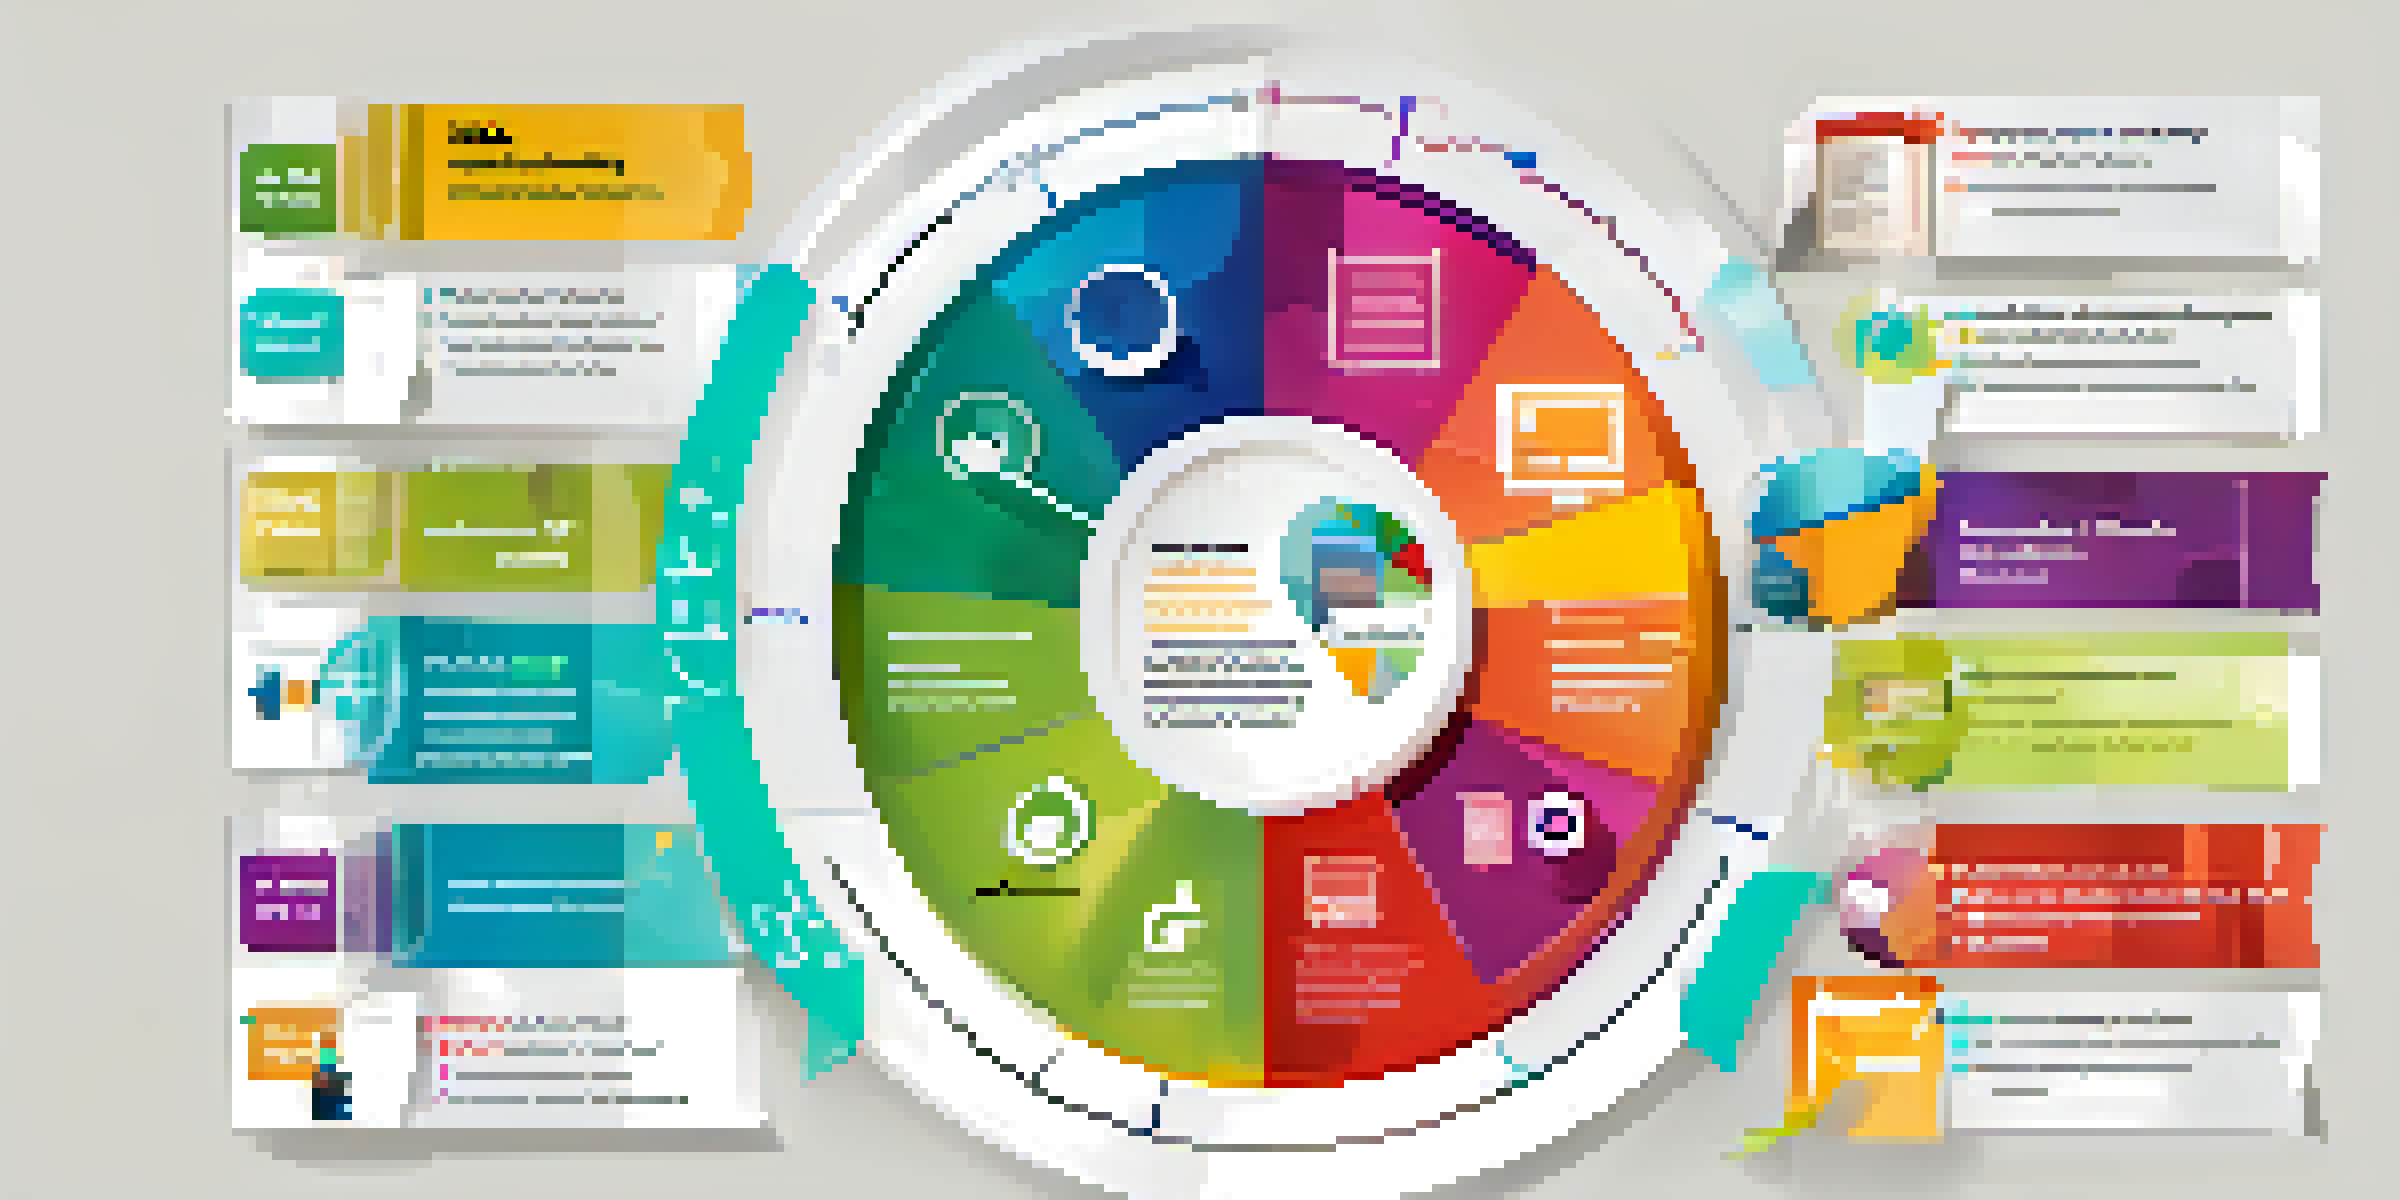
Different types of visual content serve various educational purposes. For instance, infographics are perfect for summarizing data or processes, while videos can demonstrate complex tasks in real-time. Understanding the strengths of each format can help you choose the most effective one for your teaching objectives.
Images are another powerful tool; they can evoke emotions or illustrate key concepts. A well-chosen photograph can spark curiosity and create a connection to the material, making it more relatable for students. Think about how a vivid image can instantly transport someone to a different place or situation.
Visuals Enhance Learning Retention
Incorporating images, videos, and infographics significantly improves information retention and comprehension for students.
Ultimately, the right visual format can transform a lesson. By aligning your content type with your learning goals, you can ensure that your audience remains engaged and retains the information presented.
Incorporating Interactive Elements into Visuals
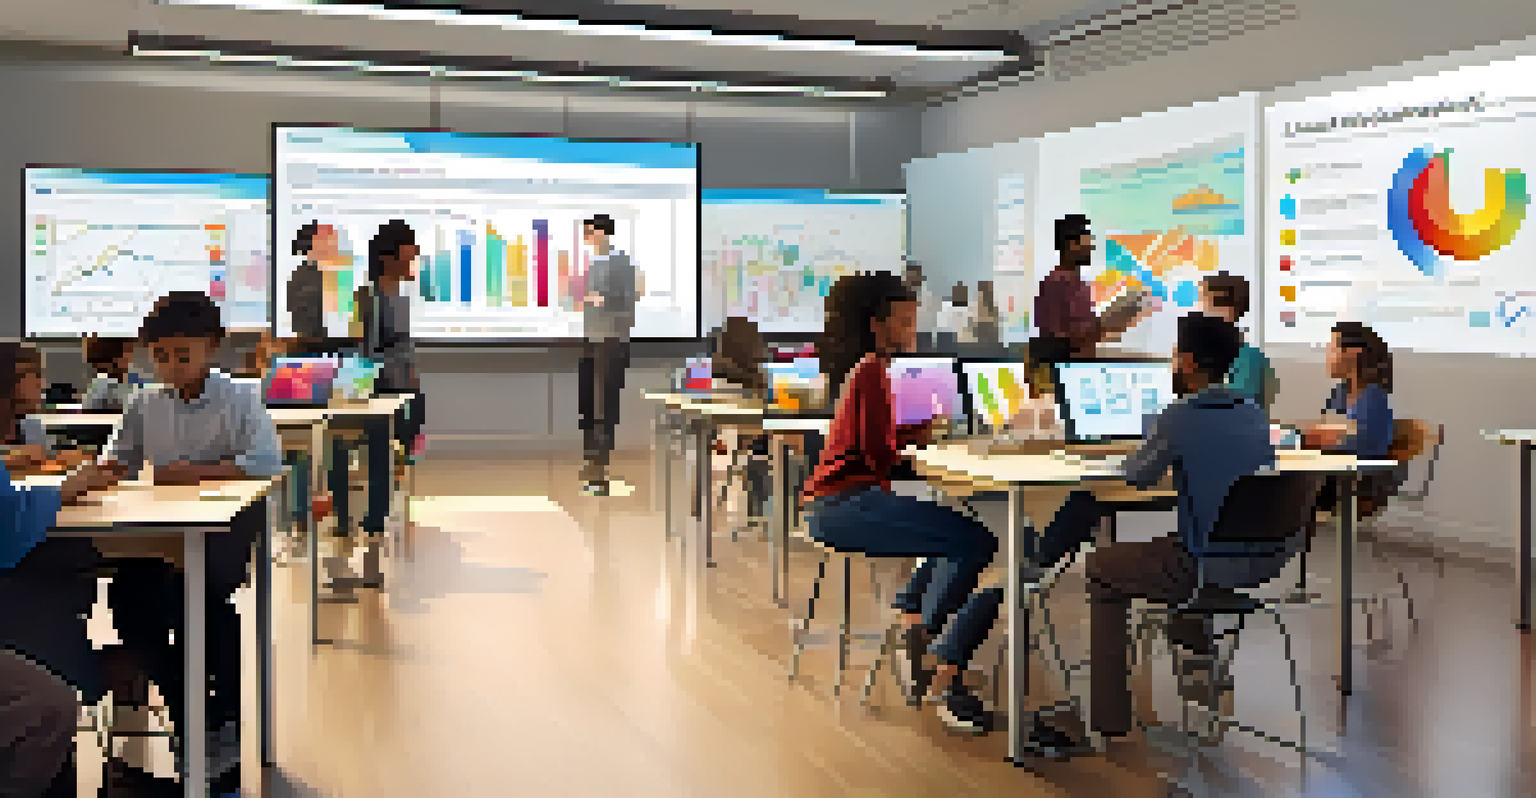
Interactive visuals are a game-changer in online learning. They encourage learners to engage actively with the content, rather than passively consuming it. For example, quizzes embedded within videos or clickable infographics can provide instant feedback and enhance the learning experience.
Storytelling is the most powerful way to put ideas into the world today.
These interactive elements foster a sense of ownership over the learning process. When students can manipulate the content—like dragging and dropping elements or answering questions—they're more likely to absorb the material. It’s like making a recipe; the more you participate, the better you understand the final dish.
Incorporating interactivity not only boosts engagement but also aids in retention. When students are actively involved, they create a deeper connection with the content, which can lead to improved learning outcomes.
Leveraging Storytelling Through Visual Content
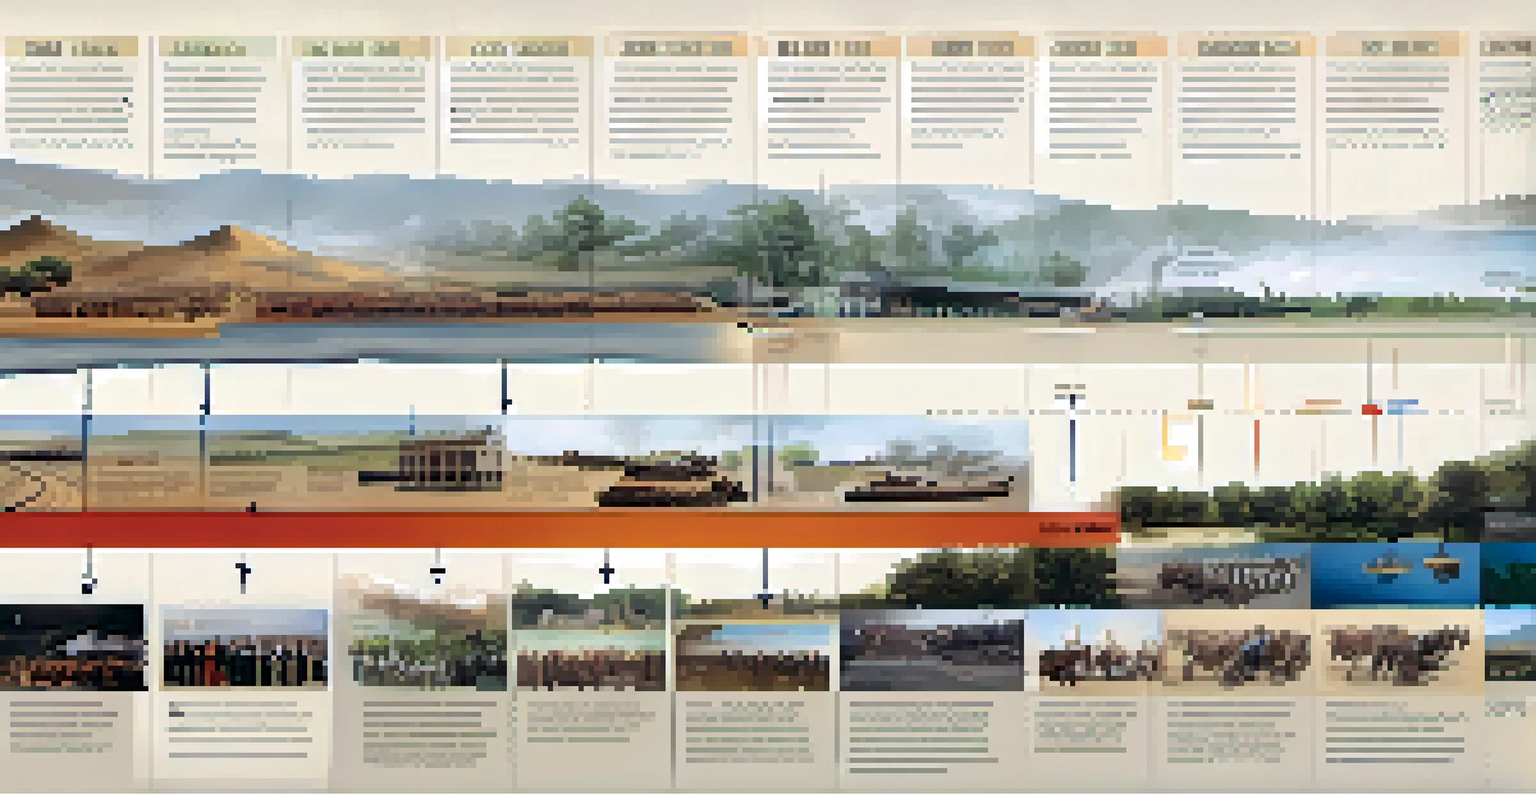
Storytelling is a powerful way to convey information, and visuals can enhance this narrative. When you present content as a story, you create an emotional connection with learners, making the information more memorable. Think of a historical event: sharing it through a compelling visual narrative can captivate your audience.
Visual storytelling allows you to break down complex information into relatable stories. For instance, using a timeline graphic to depict historical events can help students understand the sequence and significance of those events. It’s like turning a textbook chapter into an engaging movie.
Interactivity Boosts Engagement
Adding interactive elements like quizzes and clickable graphics encourages active participation, leading to better learning outcomes.
Ultimately, weaving storytelling into your visual content can transform the learning experience. By creating a narrative, you not only inform but also inspire and motivate your learners to engage with the material on a deeper level.
Designing Visually Appealing Content
Aesthetics matter when it comes to visual content in online learning. A clean, organized design helps guide the learner’s eye and makes the information easier to digest. Think of a cluttered webpage versus a well-structured one; the latter is undoubtedly more inviting and user-friendly.
Using colors, fonts, and layouts effectively can enhance the overall learning experience. For example, contrasting colors can highlight important information, while consistent fonts create a cohesive look. This attention to detail can elevate the perceived quality of your learning materials.
In summary, investing time in designing visually appealing content pays off. Not only does it enhance engagement, but it also reflects professionalism, making learners more likely to trust and value the material presented.
Utilizing Data Visualization for Enhanced Understanding
Data visualization transforms raw data into visual formats that are easier to understand. Charts, graphs, and dashboards can convey complex information at a glance, making it simpler for learners to interpret and analyze. Imagine trying to decipher a long list of numbers; a well-designed chart can instantly reveal trends and patterns.
For instance, using bar graphs to compare statistics allows learners to visualize differences more clearly. This can be particularly beneficial in subjects like science or economics, where data plays a vital role. It’s like turning a complicated math problem into a straightforward visual equation.
Effective Design Elevates Content
Aesthetically pleasing and well-organized visual content enhances user experience and reflects professionalism, fostering trust in the material.
By leveraging data visualization, you empower learners to make informed decisions based on the information presented. This skill is essential in today’s data-driven world, where being able to interpret visuals can significantly impact one’s understanding and application of knowledge.
Evaluating the Effectiveness of Visual Content
Creating visual content is just the first step; evaluating its effectiveness is equally important. Gathering feedback from learners can provide insights into what works and what doesn’t. For example, after a course, ask students which visuals aided their understanding the most and why.
Moreover, analyzing engagement metrics can shed light on how well your visuals resonate with your audience. Tools like quizzes or polls can gauge comprehension and retention, helping you refine your content. It’s akin to tuning an instrument; regular evaluation ensures everything sounds just right.
Ultimately, continuous evaluation helps enhance the quality of your visual content. By being responsive to feedback and data, you can create even more engaging and effective learning experiences for your students.